
Measuring beyond the obvious.
Unique and monthly active visitors are the latest metrics to publicly assassinated. A couple of months back, Ev Williams from Medium made a solid case for why it’s a shallow measure of attention and why the team at Medium.com focus on active time reading. And he’s got a good point.
Whether you’re a media company or marketer, it’s all about content. You might be funded by advertiser revenue or just want to grow and retain your customer based; either way the aim is to win attention/mind share. And to do this, you need to understand what works.
Which is not as easy as it sounds. What’s clear though, is that unique visitors isn’t the right metric.
Visitors numbers
Watching unique visitors / visitor numbers only tracks on thing: arrivals at your site. This is certainly important but it doesn’t tell you how good your content is. (If anything, it gives you an idea of how good your promotion is).
To know more about how well your content holds people’s attention, you need a way to measure the attention people give to it once they’ve arrived. Put another way, there’s no point having breadth if you don’t have depth. Attention is depth.
So what are the options?
Time on page / time on site
These are often suggested as measures of quality. On paper, they sound great; in reality, time on page is useless. We should really call it “time between loading tabs” because:
- They can only measure time against visit that consists of multiple tabs within your site and
- They don’t indicate how long the visitor actually spent on your site or on the page in question.
Not to mention that high dwell times could just as easily show users struggling to find the information they’re after. Duration means nothing without context.
Sorry Ev, but unless you’ve configured a custom way to track the time a user is actively looking at a tabbed web page, it’s a poor measure.
Pixel beacons and scroll-depth
Pixel beacons offer another way to measure long-form written web content. Instead of relying on the time between page requests, these measure the scroll depth of different users. By tracking the percentage of an article scrolled, we get an idea of how much content they actually saw. Crazy Egg analytics and several other tools offer a specific scroll-depth report. It’s surprising that the big analytics tool (Google Analytics, Sitecatalyst, Webtrends) aren’t offering this out of the box yet, but as ever there are workarounds.
But once again, making assumptions about user behaviour is risky:
Awkward use case 1: person visiting the website is looking for a specific phrase or quotation. They land on the page, ctrl+F search for the key phrase, scroll down to it, copy text and exit the site. It would appear that they’ve seen half the article. Despite only spending a few seconds on the page.
Awkward use case 2: the user visits and decides to read the comments, ignoring the article. Although they’ve scrolled down the entire length of the article, they still haven’t actually read it.
The assumed “I visit a website, read the whole article and leave the website”, doesn’t necessarily happen. By assuming and not testing this assumption, you run the risk of invalidating the metric.
Monthly Active Users (MAU)
This metric (or even a MAU to users ratio) measures a different dimension of your content: how good you are at sustaining attention. Which is But that’s measuring the overall quality of your publication, not an individual piece of content.
Applause metrics
This is a great term used to describe any or all of the following:
- Likes
- Favourites
- Reposts
- Shares
Might any of these provide a useful measure of engagement? Unfortunately, no. Almost as many people share articles without reading them as share them after having finished:
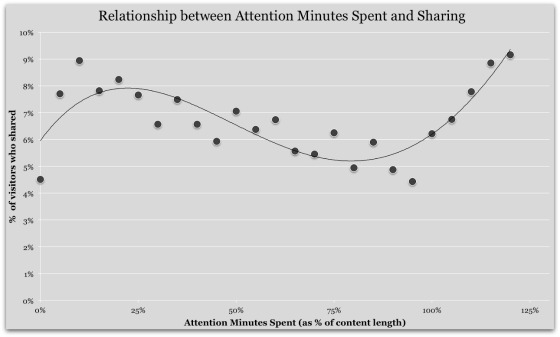
“While Upworthy sees a burst of tweets from people who have consumed just a quarter of the article, it sees an ever greater boost once people have consumed the whole thing”
Others (feasibly) could also be reading without sharing.
I’ve not seen data for likes and favourites, but it’s possible they operate similarly. Without strong evidence to show that applause metrics are consistently tied to meaningful engagement with content, this might not mean all that much.
Comments on articles
If you ask a question there’s no guarantee you’ll get a reply. You might find the reply is disapproving of your question. Or harder still, the reply may not make sense.
And so it is with comments. Several major online publications have removed this feature entirely, finding that moderating spam posts and vitriolic rants was distracting from productive discussion about articles. Comments might indicate engagement; they might also be meaningless.
So how exactly do we measure content marketing?
I didn’t set out to assassinate every other metric available. The ones above are mostly useful, but not phenomenally so. Personally, I’d avoid optimising for any single one of these.
The main challenge is that article content isn’t identical. Some are beautifully written, but would appeal to just a few thousand of the Internet’s millions of users. Others are trash but get read by millions. And some spark furious discussion. But very few will be all three: well written, well read and heavily debated.
The answer, therefore, doesn’t lie in any one metric. Instead, it’s about reviewing multiple metrics and understanding how articles perform across a range of aspects.
I’m working up my own approach and criteria, but as a starting point I’d read up on these two areas:
- Website functionalism (coined by Semphonic back in 2006). Web pages each perform different functions, whether it’s routing people to another section or completing a purchase. So it’s logical to assign different metrics (such as resurface rate) to pages to track how well they’re performing these different functions.Functionalism helps classify pages into types based on their role, and then assigns metrics accordingly.
- The Conversation, Amplification, Applause and Economic Value of social media. This framework assesses social media against four sets of criteria, measuring how well it delivers on each.
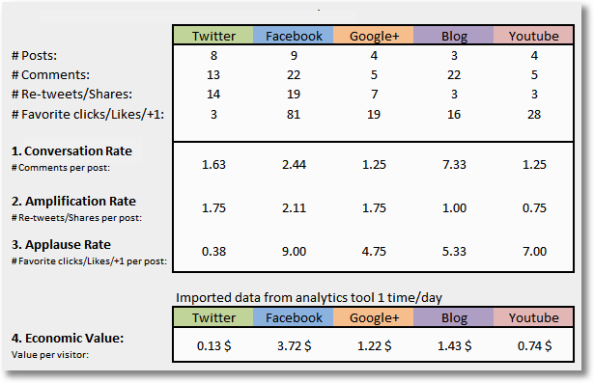
(Developed by Erik Ohlen)
I see measuring content marketing as part way between the two. Content is not one-dimensional, so it needs to be assessed against multiple criteria. It can also serve different functions, so specific sets of criteria or performance levels should be allocated based on this function.
Next steps
Unless we challenge the way value is assigned, we’ll never really understand what makes some things more valuable than others. Written content has been around for millennia, but it’s only recently that we’ve had the ability to calculate how it is read, shared, retained and the impact is has on us. We’ve got a long way to go, but we’re finally going beyond a simple understanding what is “popular”. The next step is to understand properly what it makes people think and how they then act.

Posted on 15/05/2015
0